
The Phillips Curve is an economic model that illustrates a stable inverse relationship between the inflation rate and the unemployment rate. It is used to show policymakers that there is an exploitable trade-off between the unemployment rate and the inflation rate i.e. unemployment can be reduced at the expense of higher inflation.
The Phillips Curve was first established in 1958 by an economist named A. W. Phillips, in which 96 years worth of data was collected on wage inflation and unemployment. The data points were plotted on a graph, with the unemployment rate on the x axis and the wage inflation rate on the y axis. A line of best fit was then drawn through this collection of data points and this line of best fit was downward sloping, showing the inverse relationship between the two variables and this has now become known as the Phillips Curve.
Since then the Phillips Curve has been adapted to provide more theoretical importance for policymakers to consider when setting economic policies. As now the inflation rate (price inflation) is used instead of wage inflation. The result of the inverse relationship still holds but now concerns the inflation rate instead.
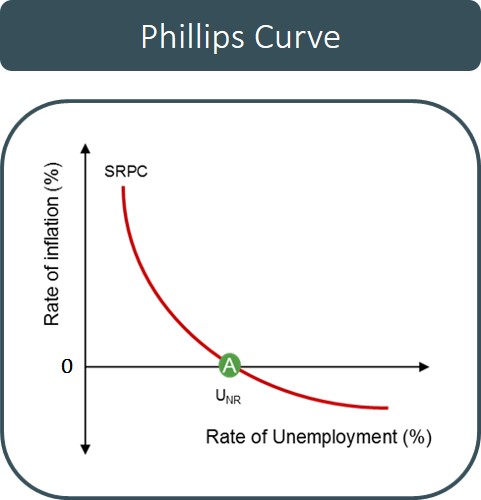
Below is a diagram to illustrate the basic convex shape of the conventional Phillips curve discovered by A. W. Phillips. This curve illustrates the main policy trade-off facing governments i.e. a government cannot achieve both low unemployment and inflation.
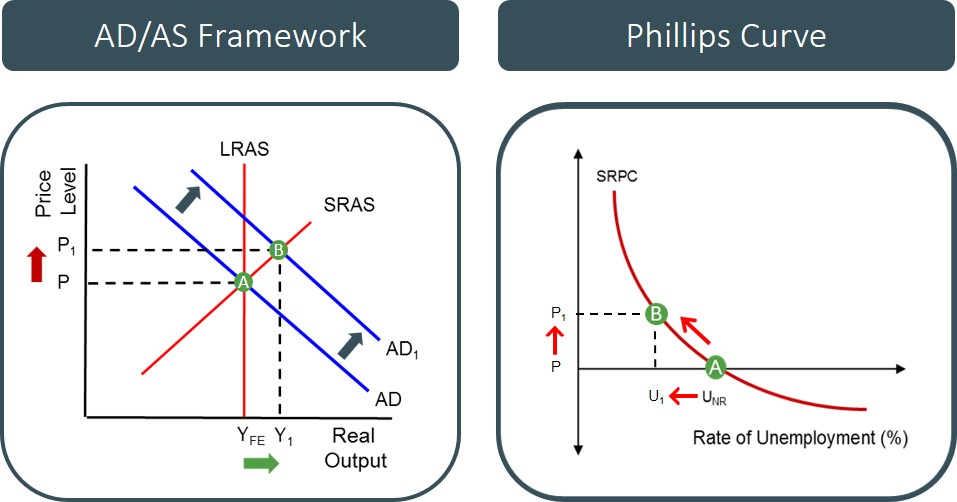
By using this curve the government can aim to reduce the unemployment rate by introducing an aggregate demand stimulus, which increases real output and unemployment in the process, but at the same time this creates inflationary pressures (demand pull inflation) as a result of a positive output gap emerging. This positive AD shift can be represented by a movement up the Phillips curve to signify an increasing inflation rate when the unemployment rate decreases.
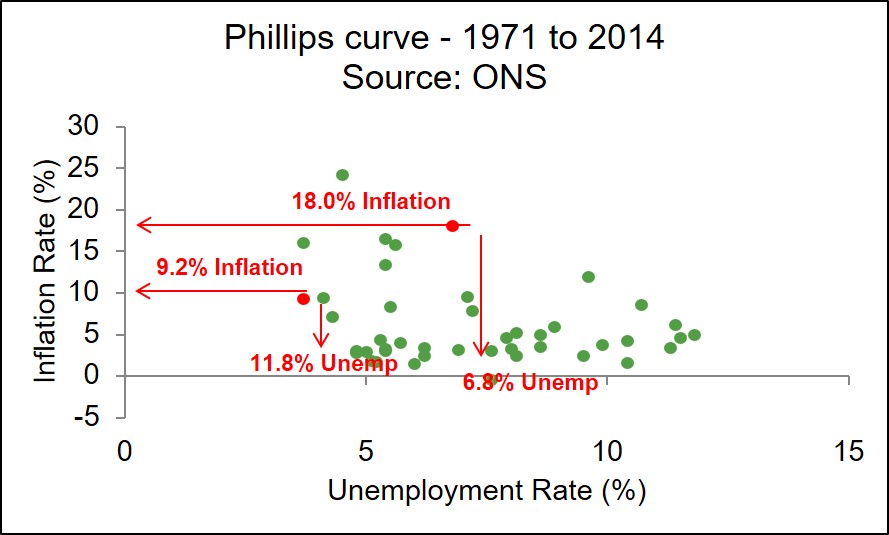
However, in the 1970's the smooth, stable inverse relationship seen in the Phillips curve between the inflation rate and the unemployment rate began to break down as suddenly data points were being recorded where both the unemployment and inflation rate were high and this contradicted the main result of the original Phillips curve.
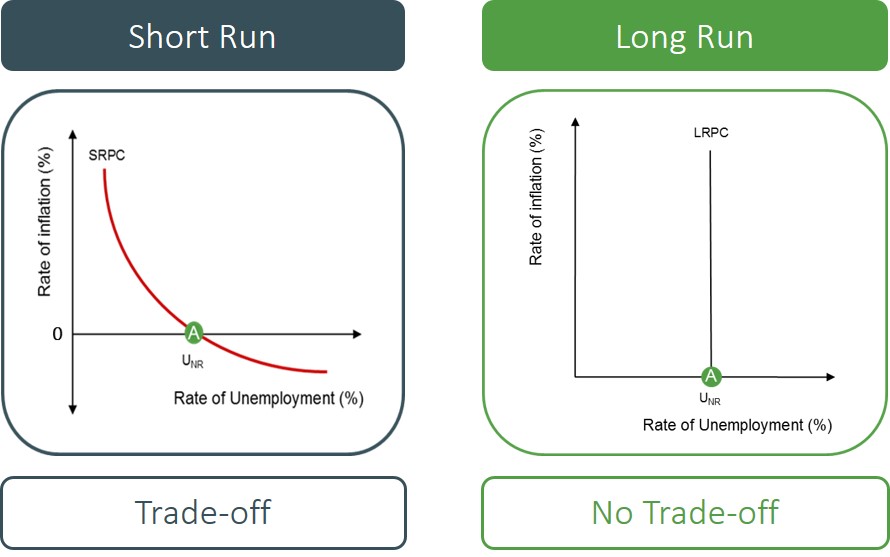
As a result of this, it was commonly accepted that in the long-run the Phillips curve would take a different form and the trade-off between inflation and unemployment would disappear. The long run Phillips curve is vertical at the natural rate of unemployment and depicts no exploitable trade-off between the inflation rate and the unemployment rate. The key difference for policymakers when dealing with the LRPC is that demand side policies designed to reduce the unemployment rate below the natural rate do not prove effective as workers re-adjust their wage aspirations in light of higher inflation, which means unemployment always remains at the same level in the long-run but with higher inflationary pressures. So effectively the long run Phillips curve is established by multiple shifts of the short run Phillips curve
The distinction between the shape of the short run and long run Phillips curve is shown below.
Therefore, in the long-run the only way to reduce the natural rate of unemployment is to introduce specific supply side policies which aim to improve the productive capacity of the economy by creating sustainable unemployment reductions, which create an LRAS shift (outwards) in the process. Persistent demand side policies will create an inflationary outcome for the economy. However, these policies must be specifically targeted to improve worker flexibility otherwise will not create the curve movements required to reduce unemployment below the natural rate.
The Phillips curve is a contentious issue as it all depends on your political persuasion, in terms of how the curve is interpreted. But, the main evaluation points regarding the Phillips curve are:
- Recent evidence from the UK economy appears to contradict the main theoretical result of the Phillips Curve i.e. data points reflecting high unemployment and inflation rate.
- The current version of the Phillips Curve is an adapted version of the original i.e. shows price inflation instead of wage inflation.
- The Phillips Curve may be subject to measurement errors/biases because data quality and changing nature of data will affect the outcome depicted by the Phillips curve.
- The distinction between the short run and long run Phillips Curve i.e the trade-off is not present in the long-run.
- To take into account the type of expectations that economic agents have i.e. if economic agents have rational expectations it might mean there is no short-run and long-run distinction between the Phillips Curve.