The curve that shows the total quantity of goods and services supplied at different price levels.
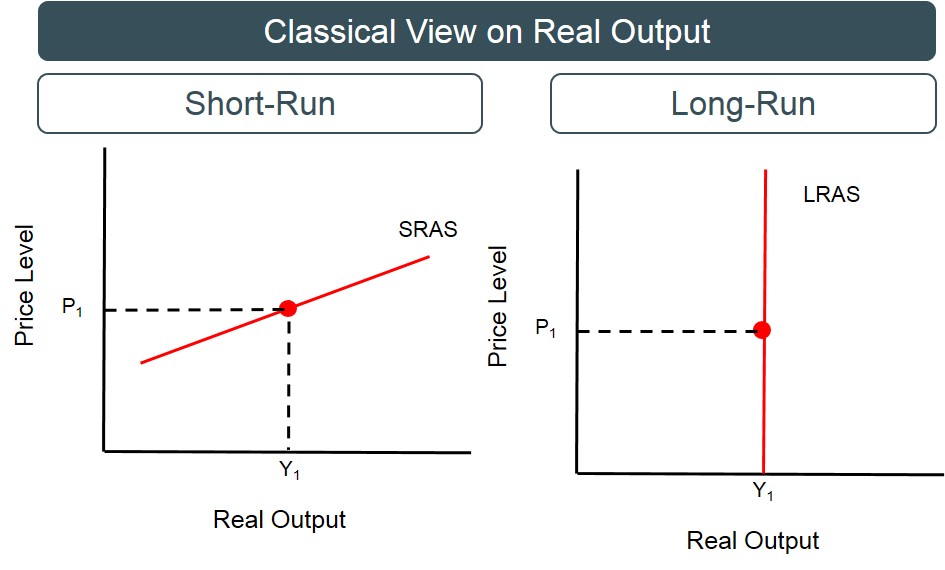
The diagram below shows the aggregate supply curve in its two time dimensions i.e. the short-run and long-run:
- The SRAS curve captures the direct short-run relationship between real output and the price level.
- The LRAS curve shows that in the long-run unless there is a change in the size or productivity of the factors of production employed, supply will always exist at the full employment level and will not vary with the price level, as the economy is at full capacity.
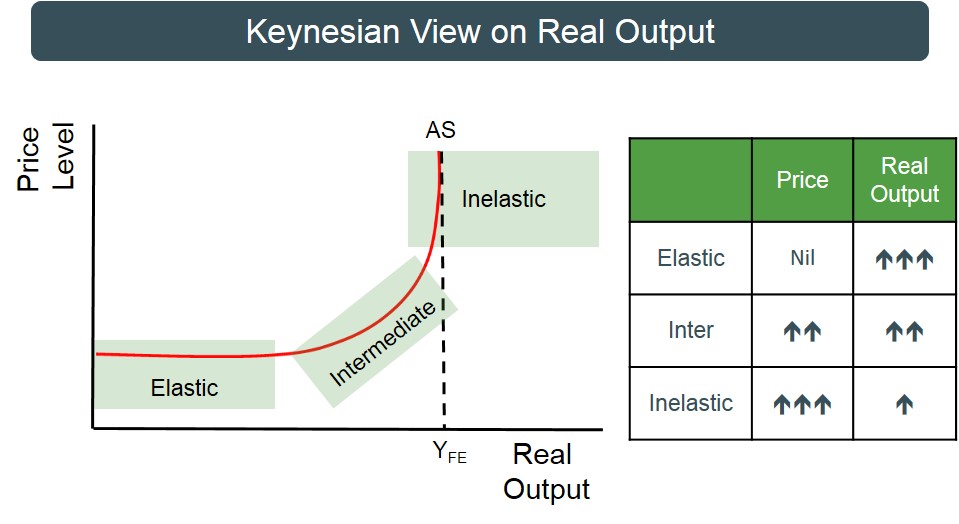
The diagram below illustrates the Keynesian AS curve. Unlike the classical view, the Keynesian view is based on a single AS curve with variable elasticity at different points to reflect the level of spare capacity in the economy at a particular point in time:
The Keynesian AS curve is perfectly elastic when there is substantial spare capacity but becomes progressively more inelastic as spare capacity diminishes. It is actually perfectly inelastic at the full employment level when there is no spare capacity remaining. The change in the elasticity of the AS curve means that the impact of AD shifts will result in differential outcomes for price level and real output.
This has important implications for predicting the outcome of economic policies. This is a useful evaluative tool that can be used in exams as this curve shows that the significance of a change in AD depends on the level of spare capacity in the economy at a particular point in time. It also provides a nice contrast with the outcomes predicted under classical theory.
The graphic below indicates the varying impact of an AD outwards curve shift would have on the price level and real output of the economy at a particular point in time depending on the segment of the Keynesian AS curve the economy is situated on.