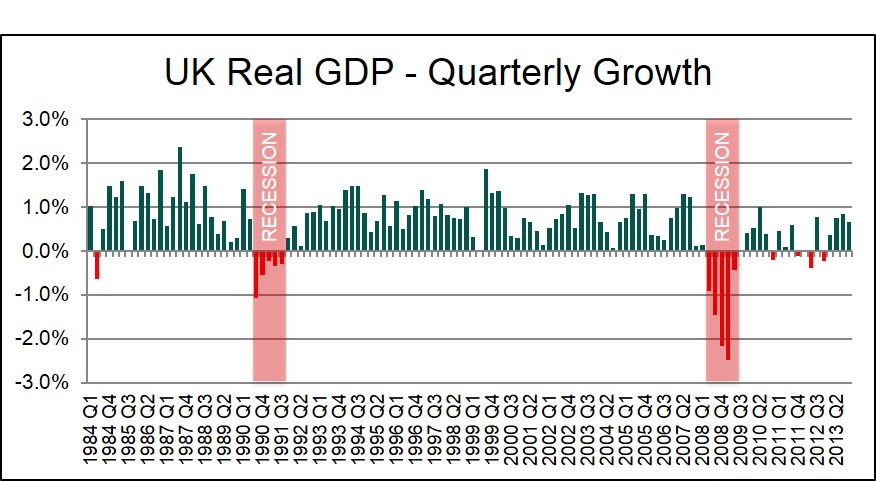
Negative real GDP growth for 2 consecutive quarters.
Below is a diagram that shows the level of real GDP growth for the UK economy in terms of quarters. As can be seen from the graph the red shaded regions represent when the economy has gone through a period of two consecutive periods of negative growth and therefore this being officially classified as a recession or a downturn. These periods correspond to the 2008 global financial crisis and the early 1990's recession.