Many digital services proclaim their success by highlighting that the most active students have achieved the best results (hardly surprising as the ’best’ students are surely likely to be the most active users of a service) or that a school’s GCSE grades had improved the year after adopting a service without any detail regarding the level of usage or how the impacts of other independent variables were managed.
While statements like this are eye-catching, how indicative are they of the value added by using a particular digital service?
In many ways, this sort of approach is exactly why the Progress 8 and other value-added rating systems have materialised. Detailing a statistical baseline makes the analysis more statistically robust.
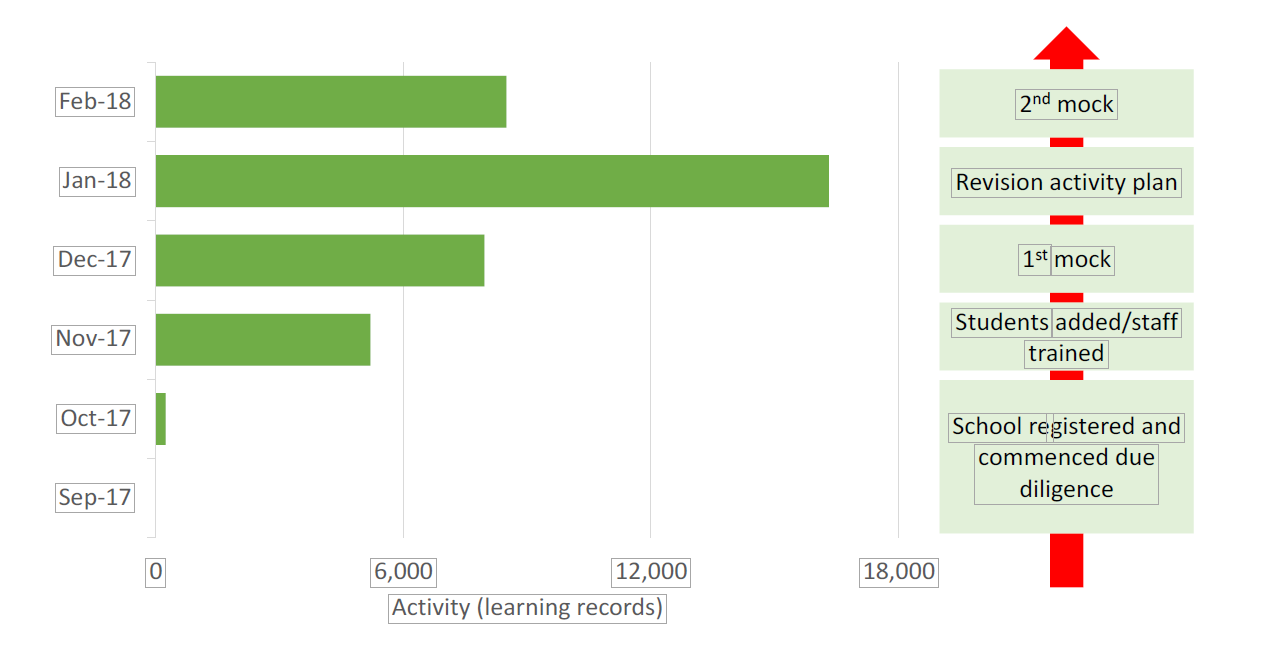
Recently one of our school users asked us to look at the impact of EzyScience on two successive mock examinations. This provided an excellent opportunity to overcome some of these issues as the first mock took place in early December, the school started actively using the service after the mock in December and the second mock examination took place in February. This allowed analysis of EzyScience activity levels and the improvement in mock examination performance achieved by the students.
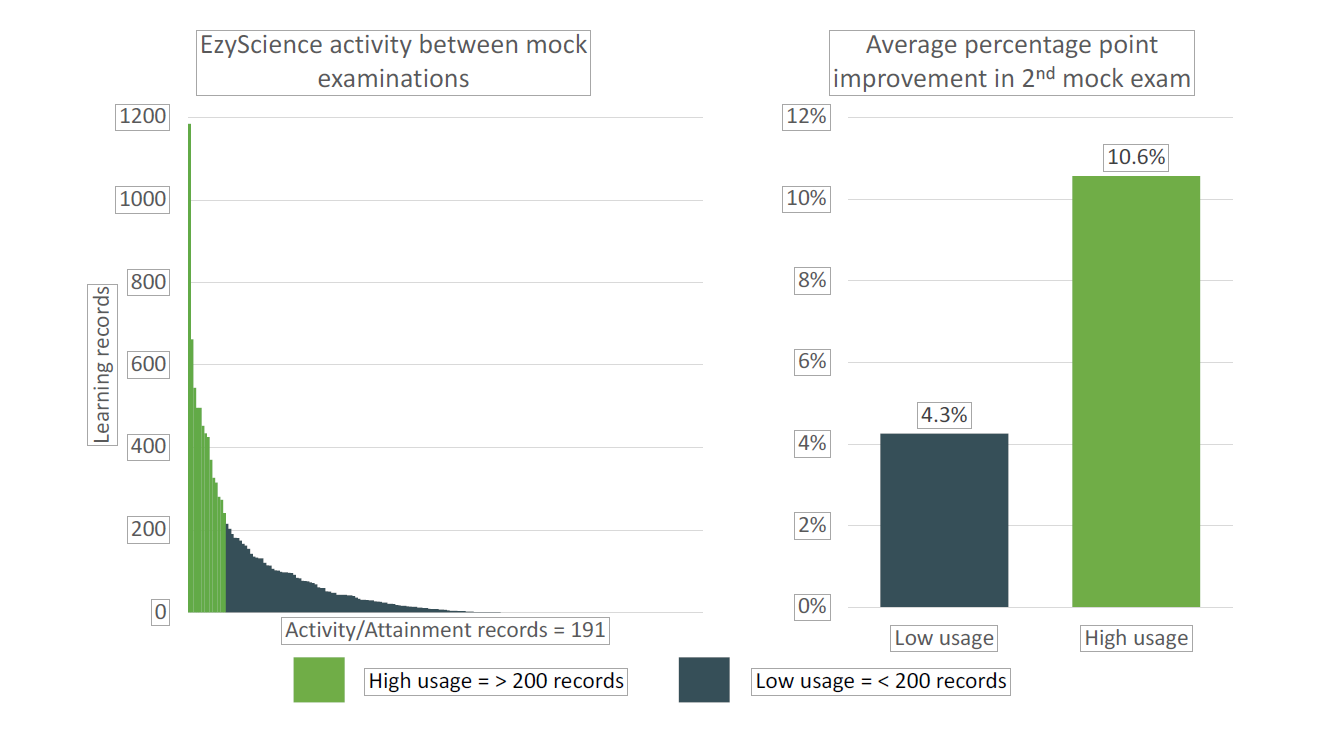
High usage users improved their mock performance by 149% more than other users
Activity at the school ranged from no activity to activity that generated 1,184 personal records in a single subject. The analytical model compared students who had logged over 200 records in a subject against all other students. 200 was selected as a level of activity that might be expected to have a meaningful impact on performance – students with this level of activity are likely to have completed at least 10 assessments.
High usage users improved mock performance by 10.6 percentage points while low usage users improved by 4.3%.

The use of the December mock and the focus upon the improvement in performance is an important method for analysing the impact EzyScience has had and minimising the potential for self-selection, i.e. the highest ability students choosing to engage more with EzyScience, distorting the results. The timing of the introduction of EzyScience was convenient for the purposes of this data.
Given that the time frame between the mock exams was short (less than 3 months), it is encouraging to see EzyScience seemingly have such a large impact upon student performance.
Clearly there is encouragement from this analysis to encourage broader and more intensive adoption by the school’s students. The school has already initiated an intervention by encouraging parental support.
Implementation timeline

Creating a digitally enabled teaching model
Avril Townson, Head of Science, Darwen Vale High School:
“Our journey with EzyScience and creating a digitally enabled teaching model has started well. Now everyone can see the impact it could have on student performance, we are focussed on developing the use of the proposition to ensure that learning does transfer out of the hard work the students will put in. In the Summer we expect to derive some significant benefits from this given the challenges of the new GCSE science syllabus.”
March 2018
