The EzyEducation website uses cookies to help ensure we give you the best experience.
If you continue without changing your settings, we assume that you are happy to receive all cookies on the EzyEducation website.
Please refer to our Privacy and Cookies Statement to

find out more.

Continue

Economic Terms

All   0-9   A B C D E F G H I J K L M N O P Q R S T U V W X Y Z

Financial Services Authority (FSA)

Responsible for the regulation of the financial services industry in the United Kingdom between 2001 and 2013. Its board was appointed by the HM Treasury, although it operated independently of government. It has later been replaced by the Bank of England and the Twin Peaks regulatory structure.

Below is an illustration of the old regulatory structure brought through by Gordon Brown, where the FSA were in sole control of regulation and supervision.


Finite resource

A resource which is scarce as it is fixed in supply and will eventually run out if it is used continuously.

First Degree Price Discrimination

when a firm decides to charge a different price for every unit consumed and by doing so can charge the maximum possible price for each unit it sells. This allows them to capture all the consumer surplus under the demand curve and to be able to convert it into producer surplus. This type of price discrimination is also commonly referred to as perfect price discrimination as it requires perfect knowledge of individuals valuations of goods. Therefore this type of price discrimination is quite rare.

Below highlights a breakdown of how a firm tries to perfectly extract as much consumer surplus away from the market to convert into producer surplus by charging each consumer their maximum valuation, as a result there is no consumer surplus left over as the demand and supply diagram shows below.


Fiscal Multiplier

The economic impact of fiscal initiatives . This value is likely to be close to 1 or even less than 1 due to the negative impact of raising tax revenue to fund initiatives.

Fiscal policy

Changes to taxes, government spending and borrowing that aim to influence the level of economic activity in order for the government to achieve the main macroeconomic objectives.

The policy works by the government changing the level of taxation and government spending over a period of time and the fiscal stance that the government decides to take all depends on the state of the economy at the time. For instance, during a recession an economy is stimulated via higher spending/lower taxes in order to inject demand and economic activity into the economy. Whereas during a boom, spending is reduced/taxes raised to help control inflationary pressures that have arisen and also governments use this period to help pay back any past borrowings which fuelled previous budget deficits i.e. national debt. 

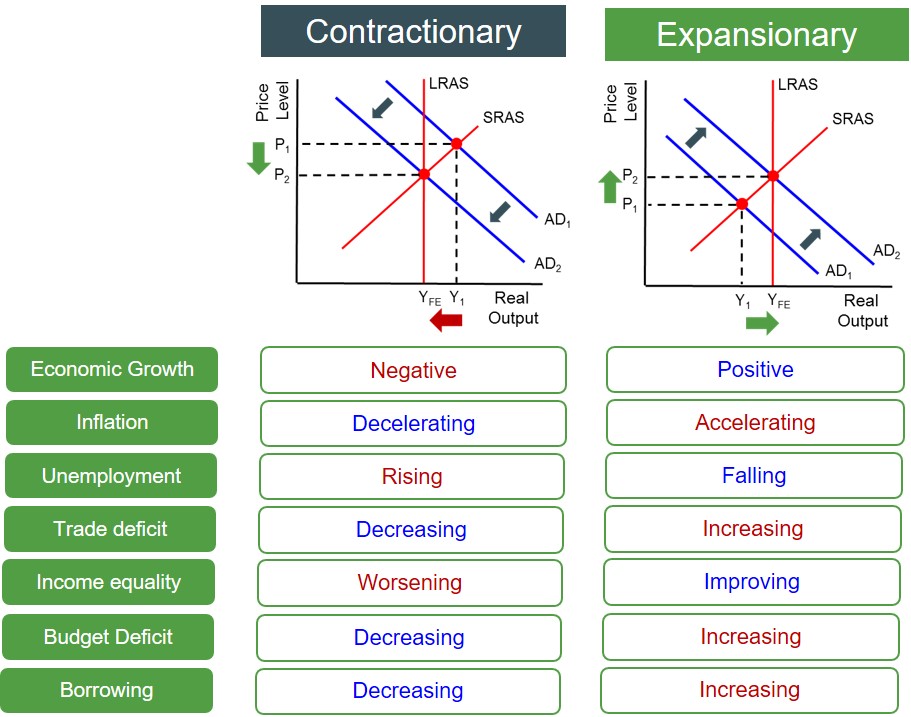
There are two different types of fiscal policy that the government can implement:

  • Expansionary Fiscal Policy - stimulates aggregate demand (injections)
  • Contractionary Fiscal Policy - restricts aggregate demand (leakages)

The impact of these policies on the main macroeconomic variables are shown below assuming ceteris paribus.

It is important to note that fiscal policies are often used alongside monetary policies, as fiscal policies should not be predominantly used to control prices as this is the role of monetary policy. 

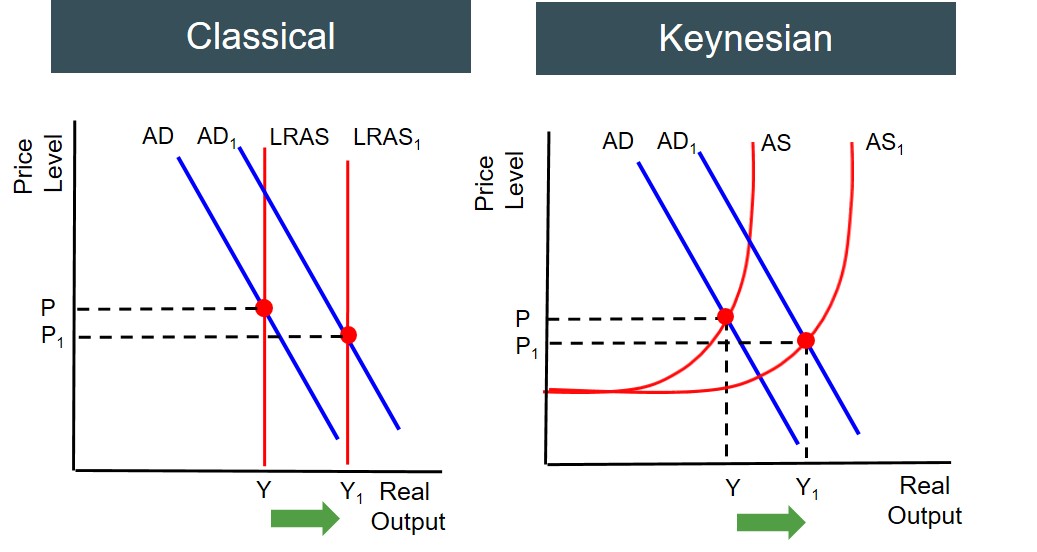
However, it is important to note that the long-run impact of a fiscal policy all depends on the sectors of the economy that the policy has targeted. For instance, if an expansionary fiscal policy is run, it predominantly increase spending by the government into the public sector. If that spending has been directed to areas of the economy with strong productivity links (e.g. education, health or transport) then productivity gains will be large and ultimately this will create an accompanying LRAS curve shift in the long run, creating dis-inflationary growth. However, if it is targeted to areas with tenuous links to productivity then it is unlikely to significantly change the position of the LRAS curve and the end result will just create inflationary pressures without growth. 

From a policymakers perspective, the desired outcome of fiscal policies is to direct spending to those productive areas of the economy to instigate the LRAS shift. This desired outcome of dis-inflationary growth is shown below from both the Classical and Keynesian perspectives.

However, as with all economic policies it is not an exact science. This is the theoretical outcome of an expansionary fiscal policy on real output and the price level but the impact seen on the economy in reality may take a different form, as a result of a few factors. 

Firstly, it is important to consider the impact of the multiplier effect on these shifts, as the larger the multiplier effect the greater the initial impact on AD. This is important for the government to consider because if the multiplier effects is large then perhaps they can increase spending by a smaller amount originally to get the desired AD curve shift. However, the size of the multiplier effect (positive or negative) can become diluted by the presence of automatic stabilisers, which can end up limiting the effectiveness of fiscal policies.

Secondly, if a government decides to increase spending then this can create resource and financial crowding out effects in the economy. This is because if the government increases spending into the public sector, this will ultimately lead to the public sector to expand. This could potentially be a problem if the economy is at full capacity because at full capacity the economy's resources are being fully utilised, so therefore to increase the size of the public sector, resources must be transferred from the private sector to the public sector, which subsequently shrinks the private sector. This is often interpreted as a problem because the private sector is profit maximising and is the sector of the economy that is the most efficient. This perhaps explains why expansionary fiscal policies are used only when the economy has spare capacity, so this crowding out effect does not happen.

Finally, when governments run budget deficits that have to fund that deficit by borrowing, but ultimately that debt has to be repaid back with interest. So it may well be that the AD curve shift is muted compared to theoretically anticipated. This is because if the government runs up a deficit via lower taxes, then this might not encourage consumers and businesses to spend and invest, if they anticipate that higher taxes will be introduced in the future to repay these debts off. It might well be the case that consumers save the tax break today in order to pay of future tax increases. It could be evaluated that this might not make much of a difference if the budget deficit is created by higher spending with a sizable multiplier effect.


Fixed capital

The premises, equipment or infrastructure used in the production process. It is not directly converted into goods or services in the way that working capital is.


Fixed costs

Production costs that do not vary in line with the number of units produced e.g. the acquisition cost of capital equipment.

Below is a list of some of the types of fixed costs that firms have to pay. For instance all businesses have to pay rent for the offices and factories that they work in. This cost is fixed because a contract is agreed and they have to pay a fixed amount of rent each month. This is the same for loan repayments or salary payments to employees.


Fixed Exchange Rate

Where the central bank intervenes in foreign currency markets and alters the level of currency demand and supply to maintain the exchange rate at a specific level. It does this by buying and selling up foreign currency reserves.

Below is a diagram to show how a central bank prevents the exchange rate from moving above its target level to a higher free floating equilibrium. There is upward pressure brought about by an increase in the demand for the domestic currency due to an increase in demand for exports, this creates an excess demand for the currency as shown below. To prevent the exchange rate from rising above the fixed rate the central bank prints more money to increase the supply of money and devalue the currency to offset the upward pressure. This new money is sold to acquire new foreign reserves, so that the foreign currency gets stronger and the domestic currency gets weaker. This downward pressure is enough to offset the upward pressure to maintain the fixed rate.

Below is a diagram to show how a central bank prevents the exchange rate fom moving below its target level to a lower free floating equilibrium. There is downward pressure brought about by an increase in the demand for the foreign currency due to an increae in demand for imports, this creates an excess supply for the domestic currency because when consumers buy foreign imports, they sell domestic currency to buy up foreign currency as the foreign imports are priced in terms of foreign currency. To prevent the exchange rate from falling below the fixed rate the central bank sells foreign currency reserves to buy up domestic currency, which increases the demand for domestic currency and creates upward pressure. By strengthening the domestic currency and weakening the foreign currency the downward pressure is offset and as a result the exchange rate remains at its fixed value.


Floating Exchange Rate

This is a type of exchange rate in which the price of one currency in terms of another currency is determined solely by market forces and is not influenced by direct intervention by central banks.

Below is an example of a market in which the exchange rate has been determined at a value that makes the demand and supply for pounds equate each other.


Flow

A flow variable is measured over an interval of time. For example, UK nominal GDP refers to the total number of pounds spent over a time period, such as a year. Therefore it is a flow variable, and has units of pounds/year.

Below highlights the idea of a flow in contrast to a stock. This shows that Real GDP is continually changing and this then gets added to the stock of real GDP to measure the size of an economy. In this instance the cumulative real GDP exceeds the current value of real GDP.


Display # 
Forgot your password?