The EzyEducation website uses cookies to help ensure we give you the best experience.
If you continue without changing your settings, we assume that you are happy to receive all cookies on the EzyEducation website.
Please refer to our Privacy and Cookies Statement to

find out more.

Continue

Economic Terms

All   0-9   A B C D E F G H I J K L M N O P Q R S T U V W X Y Z

Law of Diminishing Marginal Returns

A firm in the short-run will eventually experience diminishing marginal returns i.e. as the firm keeps on adding a flexible factor (labour), the amount the additional resource can produce decreases.

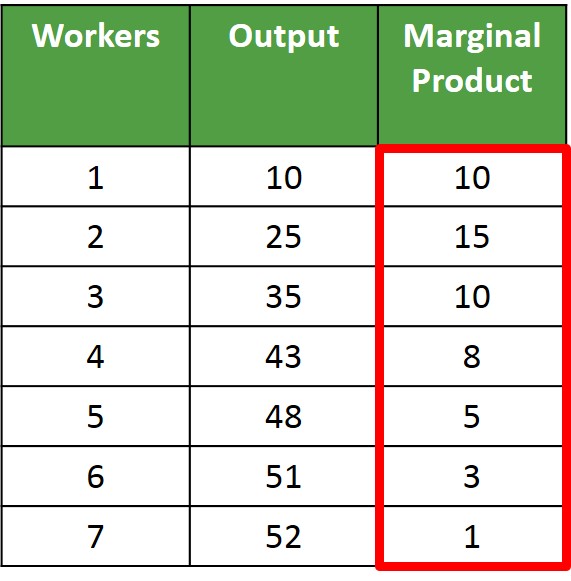
Below is an example of how the law of diminishing marginal returns can be illustrated both graphically and numerically. The marginal product is positive for each additional worker, which emphasises that each worker is contributing to the level of output for the firm. But this marginal product starts increasing at a decreasing rate after worker 2. This does not mean that any workers employed after worker 2 is less productive and less efficient but just that the conditions in the workplace for this firm to absorb extra workers without additional capital and infrastructure is restricting the amount of output future workers can make. For instance, if a bakery shop keeps employing new bakers without increasing the number of ovens available for bakers to use will mean that the value of each additional baker hired in terms of output will be lower, as each of the bakers are having to queue up to use each of the ovens.

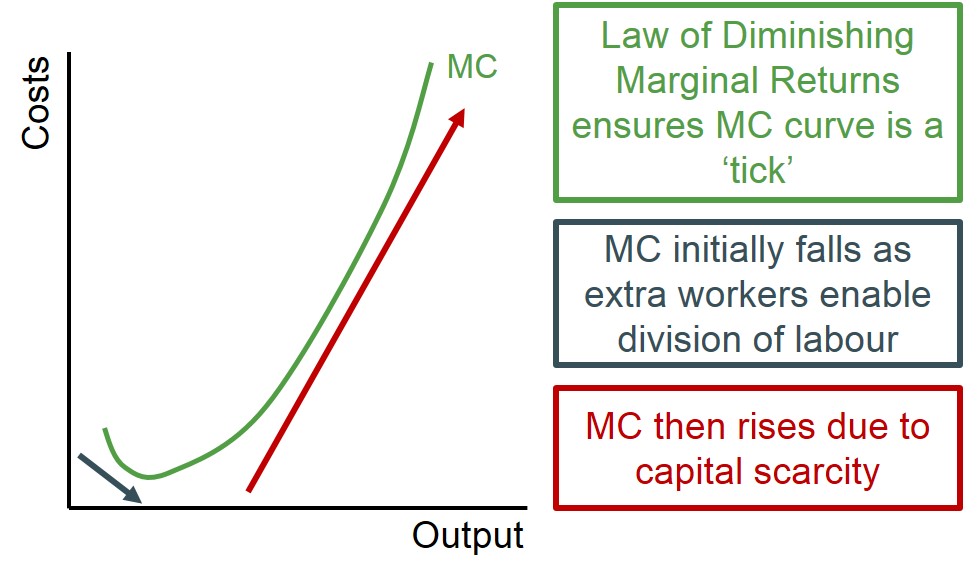
Therefore, given that this law exists this causes the marginal cost curve to have the shape that it has below. This is because the marginal product is rising for the first extra workers hired and therefore the marginal cost is low. But as the marginal product belonging to each worker begins to fall the marginal cost begins to rise as the firm moves closer and closer towards full capacity.


Law of Diminishing Marginal Utility

This is an economic law that states that the marginal utility received decreases as a consumer buys more units of a good. This happens because in the eyes of the consumers the value of the good diminishes for every extra unit they buy e.g. a chocolate bar. However, this does not mean that consuming an extra unit does increase total utility, just that it may not add as much utility as the previous units.

Below illustrates the declining utility for a consumer for every additional chocolate bar they consume but total utility continues to increase.


Leakages

Negative flows out of the circular flow of income generated by payments for imports, taxes and savings.

Below is an illustration of some of the most common leakages which draw money out of the circular flow of income and expenditure towards foreign entities. The most obvious example of this is the demand for a foreign country's imports, as well as forms of savings being placed in foreign financial institutions.


Lender of last resort

The main role of the Bank Of England. In the event that banks or the government is not able to borrow money from commercial markets the Bank of England is required by law to make finance available e.g. if the markets do not take up the offer of a new issue of gilts by the UK government, the Bank of England is legally obliged to do so.

Liabilities

The claims that agents have on the bank and these are used to finance the banks asset purchases.


Libertarian Paternalism

The notion that free will and free choice should be preserved, however the government acts to influence a citizen's choice to improve social welfare.


LIBOR

(London Interbank Offered Interest Rate) is the average interest rate estimated by leading banks in London that the average leading bank would be charged if borrowing from other banks i.e. the bidding rate for overnight loans.


Limit Pricing

Is a pricing strategy, where products are sold by the firm at a price which is lower than the average cost of production or at a price low enough to make in unprofitable for other players to enter the market.

Below is a diagram to illustrate how this type of pricing strategy works. The reason why firms undertake this pricing strategy is to protect their market share and position by successfully deterring new entrants from coming into the market. To do this however the incumbent firm has to sacrifice the amount of supernormal profit they can achieve. In the lefthand side diagram the incumbent has lower costs than new entrants, therefore if they both charge the same price incumbent firms make a large amount of supernormal profit equal to the size of the green arrow. However, new entrants at that price can also make profits due to the price being positioned above their respective LRAC curve (but these profits are substantially lower). So if the incumbent firm did not change the pricing stratey new entrants would always have the profit incentive to enter the market. However, if the incumbent firm takes advantage of their lower costs and charges lower prices to a point which is equal to the point on the LRAC curve for new entrants. These entrants would no longer have any profit incentive to enter the market as they will be charging a price at the marginal cost and just making normal profit. Therefore, incumbent firms sacrifice short-term supernormal profits to guarantee larger long-term profits equal to the size of the red arrow in the right hand side diagram. This is an example of successful limit pricing with the aim to protect and consolidate their market share and position.


Liquidity

How easy it is to convert an asset into cash without experiencing a significant price impact or encashment delay e.g. an instant access deposit would be regarded as highly liquid while a property asset would be regarded as highly illiquid.


Liquidity Coverage Ratio

A ratio used to ensure that financial institutions have the necessary assets on hand to meet short-term liquidity requirements. Under this standard, the banks must hold a stock of unencumbered liquid assets to cover the total net cash outflows.

Below is the formula for calculating the LCR ratio. This ratio must exceed 1 in order for the financial institution to have enough liquid assets to cover volatile liabilites and remain in a solvent position on the balance sheet.


Display # 
Forgot your password?