The EzyEducation website uses cookies to help ensure we give you the best experience.
If you continue without changing your settings, we assume that you are happy to receive all cookies on the EzyEducation website.
Please refer to our Privacy and Cookies Statement to

find out more.

Continue

Economic Terms

0-9   A B C D E F G H I J K L M N O P Q R S T U V W X Y Z

Static Expectations

When economic agents form their inflation expectations on the basis that nothing in the economy changes i.e. they ignore the fact that inflation can change.


Static model

A model that considers a particular issue at a set point in time.

Steady inflation

Prices rise in a steady and consistent manner without ever rising rapidly. This is the target of most economies as a consistent and modest rate of inflation encourages consumption and investment.

It is important when evaluating the inflation rate in an economy, to judge how quickly the inflation rate is rising. This is because the impact on economic agents from inflation depends on the type of inflation in the economy

  • Rising and volatile inflation is bad for the economy as it creates uncertainty and reduces confidence, consumption and investment
  • Modest, steady and consistent inflation creates macroeconomic stability and encourages economic activity such as consumption. 
  • Low and falling inflation raises fears over deflation and this discourages economic activity as economic agents await further price falls.

Below is a diagram to depict controlled and steady inflation in an economy. In this situation the economy is below full employment and therefore has a significant amount of spare capacity available. This means a positive aggregate demand curve shift  does not raise concerns about the inflation rate as a result of the economy being below full employment. This type of inflation is not damaging and this highlights the role of the MPC to ensure that this type of steady inflation is met and it does not escalate to runaway inflation. 

In an exam if you are evaluating inflation rate increases, the position of the economy (level of spare capacity available) will affect how the inflation rate increase is perceived in the wider economy.


Stock

Is the accumulation of wealth contributed by continous flows. A stock is the opposite of a flow as it is very rarely spent and is made up of assets that are not very liquid. The idea of a stock can be thought of as a bath tub with water inside it (stock) and the flow of water from the tap (flow) adds to the already accumulated water. Just like an income does to a person's wealth.


Store of Value

A liquid store of value provides individuals with the ability to accumulate their wealth in any form, at any time can convert this money instantaneously into goods and services. This is one of the three functions of a successful and efficient monetary system, alongside a medium of exchange and a unit of account.


Structural unemployment

When production in a particular industry ceases due to long term changes in demand or production techniques. This type of unemployment can persist for long periods if an industry accounted for a large proportion of jobs in a particular region as this means there will be relatively few alternative jobs for workers to turn their skill sets to. 

Below is an illustration of the impact of structural unemployment on the economy. For example if a steel company closed down in the UK this is likely to make lots of people unemployed for a long period of time, because these workers might not be able to afford to migrate to other parts of the country to take work in a new steel mill or workers skills become defunct and they struggle to settle into another industry. As this shrinks the capacity of the economy it causes the LRAS curve to shift inwards and creates a permanently higher level of unemployment.


Subsidies

Payments made by governments to suppliers to encourage the supply of particular goods. This is common in agricultural markets and goods with environmental benefits.

Below is a diagram to illustrate a market which has had the benefit of a government subsidy. In this instance, the subsidy encourages producers to produce more goods causing the supply curve to outwardly shift. This is because the costs of production have fallen due to the money from the subsidy. However, this creates excess supply so the price has to fall in order for the market to clear and this causes the amount of goods sold to increase as lower prices fuels higher demand.


Subsidy

A payment made by governments to suppliers to encourage the supply of particular goods. This is common in agricultural markets and goods with environmental benefits.

Below is a diagram to illustrate the impact of a subsidy being given to farmers in the potato market. In this instance, the subsidy encourages producers to produce more goods causing the supply curve to outwardly shift to S1. This is because the costs of production have effectively fallen, as the subsidy provider (government) has paid part of the cost of production. The impact this has on the market is that it encourages producers to produce more of the good they are producing, shifting the supply curve to S1. This creates excess supply in the market and puts pressure on the price to fall in order for the market to clear (as the demand curve has remained unchanged) and this causes the amount of goods sold to increase as the lower price fuels higher demand.
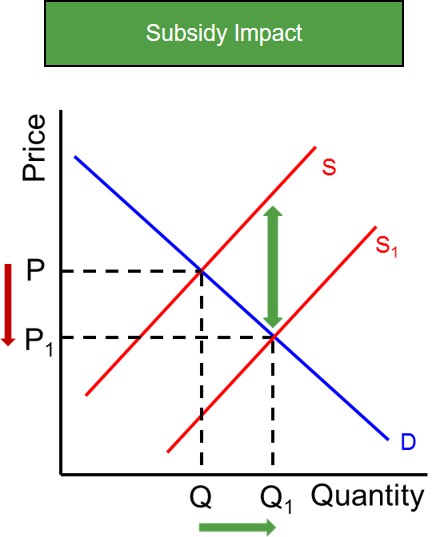
Subsidies are used predominantly by the government to reduce or remove externalities (dead weight loss triangle) that exist because of under-consumption and under-provision of a good i.e. positive consumption externalities, positive production externalities and merit goods.

However, when evaluating the effectiveness of subsidies it is important to take into account the price elasticity of demand. The more inelastic the demand curve the greater the price fall in the market. Where as with an elastic demand curve, the price fall is smaller as producers do not pass a large percentage of the subsidy onto consumers.
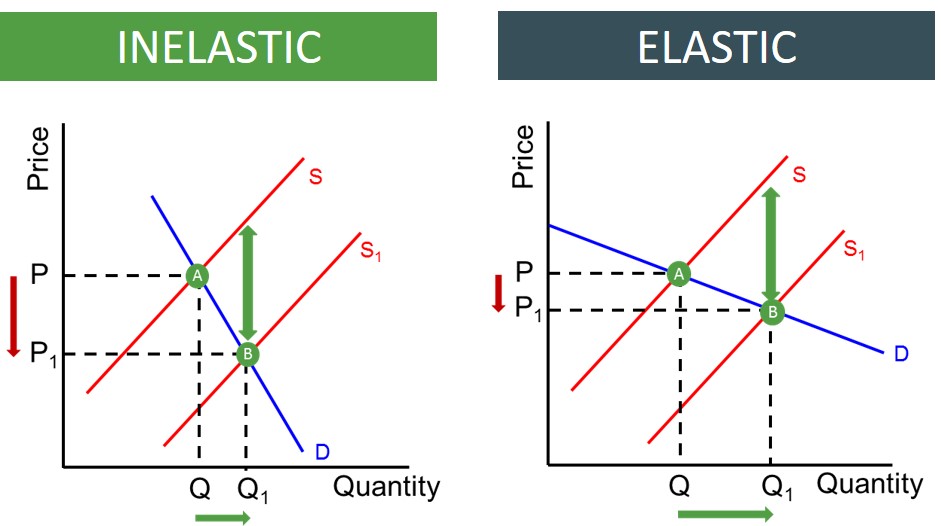
 

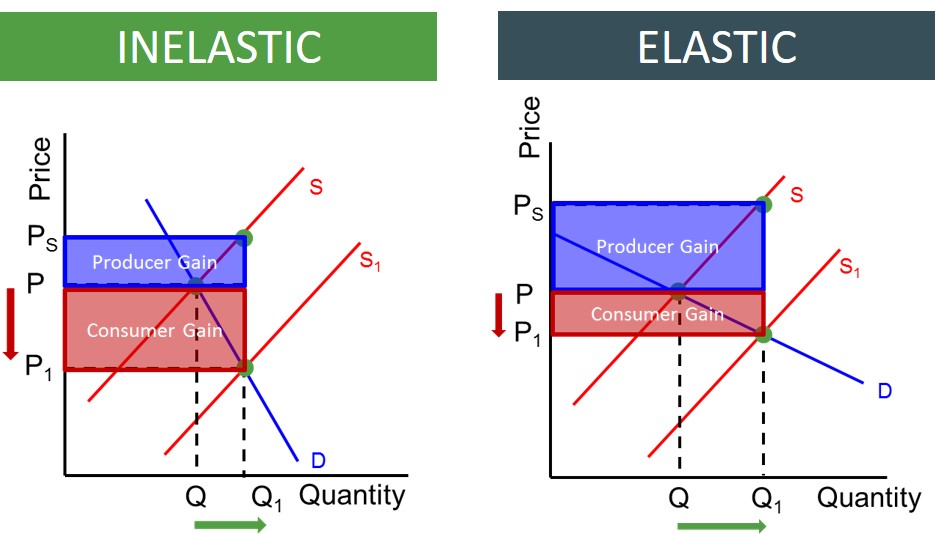
The degree of elasticity also affects who benefits from the imposition of a subsidy. The more inelastic the demand curve, the greater the benefit for consumers as a large percentage of the subsidy is passed onto consumers via a lower market price. However, when the demand curve is elastic, the smaller the price fall and the smaller the subsidy gain for consumers as a result of a smaller price fall. Conversely, producers take most of the subsidy benefit when the demand curve is elastic, as they keep hold of much of the cost savings from the subsidy. Below is a set of diagrams to show how the incidence of the subsidy (producer and consumer benefits) depends on the elasticity of demand. 
 

Despite all of this, it is much harder in reality to grant an industry a subsidy, as governments do not know the precise size of the externality in the market. This is because externalities are difficult to value and therefore the governments attempts are just estimates of the value of the externality. These estimates are unlikely to be precisely accurate as some goods may exhibit different externalities when consumed or produced by different agents. All of this means making a decision about providing a subsidy or the size of a subsidy is difficult.


Substitute good

A good that satisfies similar needs and may be consumed as an alternative to another good e.g. olive oil spread instead of butter.

Below is a diagram to show two goods that are substitutes. Therefore consumers perceive these products as practically carrying out the same function as each other. Therefore if there are price changes this will affect the demand of both products. If Good B's price rises this causes consumers to switch towards the cheaper product i.e. Good A. Therefore this diagramatically is represented by an outwards shift in Good A's demand curve at any given price.

If Good B's pricefalls this causes consumers to switch expenditure away from Good A as that is more expensive compared to Good B. Therefore this diagramatically is represented by an inwards shift in Good A's demand curve at any given price.


Substitute goods

A good that satisfies similar needs and may be consumed as an alternative to another good e.g. olive oil spread instead of butter.

Below is a diagram to show two goods that are substitutes. Therefore consumers perceive these products as practically carrying out the same function as each other. Therefore if there are price changes this will affect the demand of both products. If Good B's price rises this causes consumers to switch towards the cheaper product i.e. Good A. Therefore this diagramatically is represented by an outwards shift in Good A's demand curve at any given price.

If Good B's pricefalls this causes consumers to switch expenditure away from Good A as that is more expensive compared to Good B. Therefore this diagramatically is represented by an inwards shift in Good A's demand curve at any given price.


Display # 
Forgot your password?