The EzyEducation website uses cookies to help ensure we give you the best experience.
If you continue without changing your settings, we assume that you are happy to receive all cookies on the EzyEducation website.
Please refer to our Privacy and Cookies Statement to

find out more.

Continue

Economic Terms

All   0-9   A B C D E F G H I J K L M N O P Q R S T U V W X Y Z

Subsidy

A payment made by governments to suppliers to encourage the supply of particular goods. This is common in agricultural markets and goods with environmental benefits.

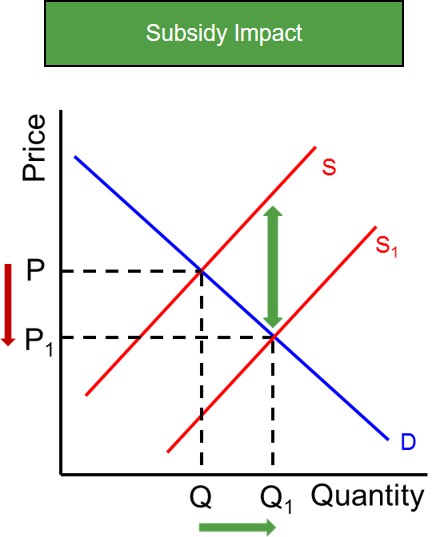
Below is a diagram to illustrate the impact of a subsidy being given to farmers in the potato market. In this instance, the subsidy encourages producers to produce more goods causing the supply curve to outwardly shift to S1. This is because the costs of production have effectively fallen, as the subsidy provider (government) has paid part of the cost of production. The impact this has on the market is that it encourages producers to produce more of the good they are producing, shifting the supply curve to S1. This creates excess supply in the market and puts pressure on the price to fall in order for the market to clear (as the demand curve has remained unchanged) and this causes the amount of goods sold to increase as the lower price fuels higher demand.

Subsidies are used predominantly by the government to reduce or remove externalities (dead weight loss triangle) that exist because of under-consumption and under-provision of a good i.e. positive consumption externalities, positive production externalities and merit goods.

However, when evaluating the effectiveness of subsidies it is important to take into account the price elasticity of demand. The more inelastic the demand curve the greater the price fall in the market. Where as with an elastic demand curve, the price fall is smaller as producers do not pass a large percentage of the subsidy onto consumers.


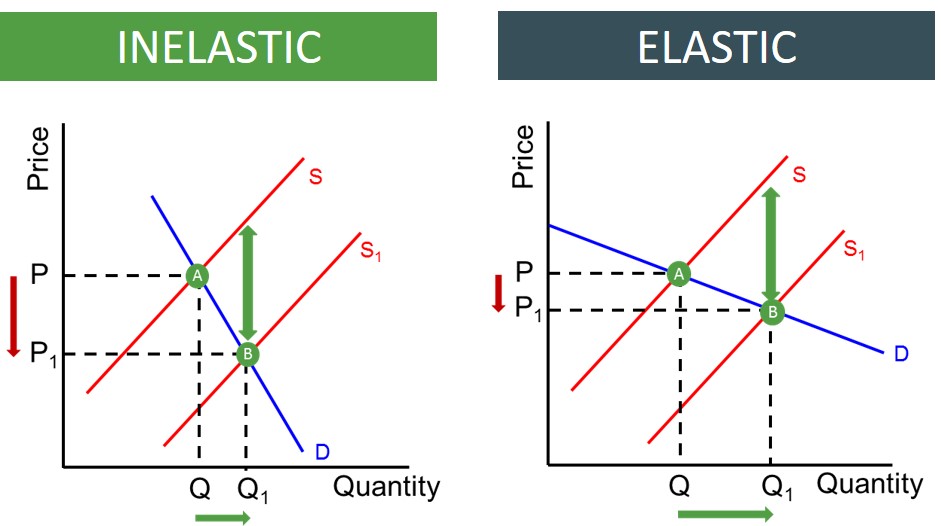
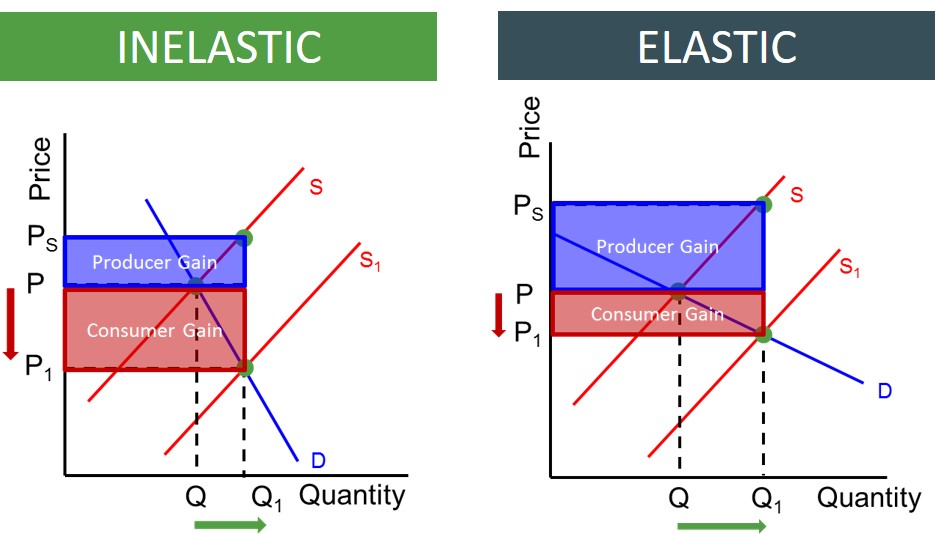
The degree of elasticity also affects who benefits from the imposition of a subsidy. The more inelastic the demand curve, the greater the benefit for consumers as a large percentage of the subsidy is passed onto consumers via a lower market price. However, when the demand curve is elastic, the smaller the price fall and the smaller the subsidy gain for consumers as a result of a smaller price fall. Conversely, producers take most of the subsidy benefit when the demand curve is elastic, as they keep hold of much of the cost savings from the subsidy. Below is a set of diagrams to show how the incidence of the subsidy (producer and consumer benefits) depends on the elasticity of demand. 


Despite all of this, it is much harder in reality to grant an industry a subsidy, as governments do not know the precise size of the externality in the market. This is because externalities are difficult to value and therefore the governments attempts are just estimates of the value of the externality. These estimates are unlikely to be precisely accurate as some goods may exhibit different externalities when consumed or produced by different agents. All of this means making a decision about providing a subsidy or the size of a subsidy is difficult.


Substitute good

A good that satisfies similar needs and may be consumed as an alternative to another good e.g. olive oil spread instead of butter.

Below is a diagram to show two goods that are substitutes. Therefore consumers perceive these products as practically carrying out the same function as each other. Therefore if there are price changes this will affect the demand of both products. If Good B's price rises this causes consumers to switch towards the cheaper product i.e. Good A. Therefore this diagramatically is represented by an outwards shift in Good A's demand curve at any given price.

If Good B's pricefalls this causes consumers to switch expenditure away from Good A as that is more expensive compared to Good B. Therefore this diagramatically is represented by an inwards shift in Good A's demand curve at any given price.


Substitute goods

A good that satisfies similar needs and may be consumed as an alternative to another good e.g. olive oil spread instead of butter.

Below is a diagram to show two goods that are substitutes. Therefore consumers perceive these products as practically carrying out the same function as each other. Therefore if there are price changes this will affect the demand of both products. If Good B's price rises this causes consumers to switch towards the cheaper product i.e. Good A. Therefore this diagramatically is represented by an outwards shift in Good A's demand curve at any given price.

If Good B's pricefalls this causes consumers to switch expenditure away from Good A as that is more expensive compared to Good B. Therefore this diagramatically is represented by an inwards shift in Good A's demand curve at any given price.


Substitutes

Goods that satisfy similar needs and may be consumed as an alternative to another good e.g. olive oil spread instead of butter.

Substitution effect

When the demand for a good changes after a price change because any substitute good will become more or less attractive if their price does not change by as much.

Sunk Cost

Costs which cannot be recovered if the firm decides to leave the market.

Below is a list of examples that can lead to unrecoverable costs arising. When firms invest in capital, this capital is subject to depreciation and as a result this piece of capital loses its value over time. This is unrecoverable as there exists no firm that would be willing to buy this unit of capital at its original price as it has depreciated over time. Advertising costs are also unrecoverable as these costs never get made back, indirectly it may help boost the firm's level of profit but the firm can never make this money back. Finally niche pieces of capital that are uniquely built for the specific production process of a firm are unlikely to provide any value and use to other firms and hence this capital cost can never be recovered as it can never be re-sold.


Supernormal Profit

Often called abnormal profit, is when a firms total sales revenue exceed the total costs of production i.e. they are earning a profit above and beyond the level of normal profit. This is the level of profit that a firm can enjoy after meeting the main production costs.

The diagram below illustrates how a monopolist exploits its monopoly power to enjoy supernormal profits. By charging a price above the marginal cost the monopolist extracts a level of sales revnue equal to the blue shaded box (P*Q). However, this is not the level of profit that firms receive as they have to cover the costs that go towards producing this product i.e. normal profit. Once the costs have been taken away from the sales revenue, any revenue left over is counted as supernormal profit - as this is the money that firms are able to use flexibly for any part of the business.


Supply

The amount of a good or service firms plan to supply to the market at a given price over a certain period of time.

Below is a diagram to show the supply curve for a good in a specific goods market.


Supply side economics

Issues that impact the supply of goods and services in the economy. This covers a wide range of issues including business taxes, education, migration, support to encourage research and development, subsidies and grants for vulnerable industries and businesses and laws regulating economic activity.

Below is an example of the two schools of thinking behind supply-side economics. The first is the classical view that there is a shift in the LRAS curve which expands the productive capacity of the economy. Then there is also the keynesian viewpoint that the supply curve which has many elasticity points shifts outwards.


Supply side fiscal policy

Government policies and initiatives that aim to increase the productive capacity (supply side) of the economy. The policies will shift long run supply curves to the right and are important to produce sustainable economic growth.

Below illustrates an expansionary supply-side policy which has successfully caused the LRAS curve to expand and therefore produce a form of sustainable growth as the productive capacity of the economy has expanded preventing any inflationary problems.


Display # 
Forgot your password?