The EzyEducation website uses cookies to help ensure we give you the best experience.
If you continue without changing your settings, we assume that you are happy to receive all cookies on the EzyEducation website.
Please refer to our Privacy and Cookies Statement to

find out more.

Continue

Economic Terms

All   0-9   A B C D E F G H I J K L M N O P Q R S T U V W X Y Z

Market failure

When the market fails to allocate resources efficiently i.e. the market uses too many or not enough resources to produce a particular good

Market power

When an individual supplier or consumer possess enough power to influence the market outcome.

Market power is highest amongst monopolists as they dominate the market and therefore do not have to worry about the reactions of rival firms. They prominently set a price above their marginal cost to extract as much supernormal profit from the market as possible compared to a firm in a competitive market as the diagram below shows.


Market share

The share of market output accounted for by a single supplier. It is normally expressed as a % share of the total output/revenue.


Market Size

Measurement of the total volume of a given market based on revenue.

Below is an example of how this can be calculated for a fictional market. This is done by adding up the total revenue of all the firms in the market and therefore is an indicator of the value of the business that these six firms are conducting.


Market structure

The characteristics of a market e.g. number of firms, barriers to entry and exit, the extent of product differentiation and any information imperfections.

Market supply

The total supply at a given price of all the individual suppliers in a market.

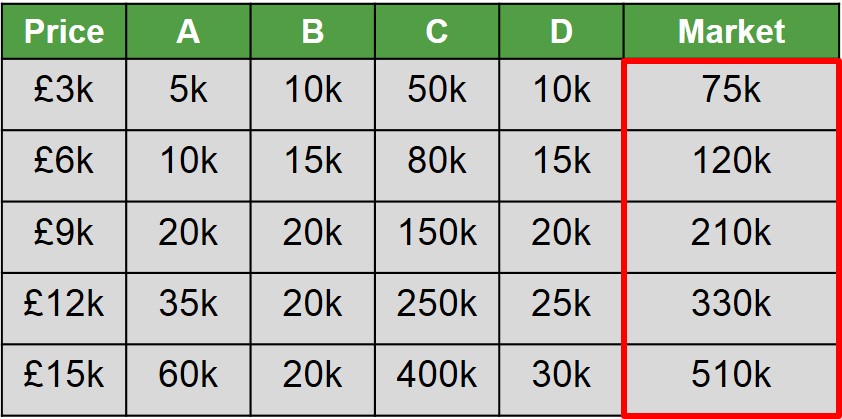
Below is an example of how to derive the market supply curve. At every individual price, it needs to be calculated how many firms are willing to produce/supply a certain amount of goods. This is shown in the table below.

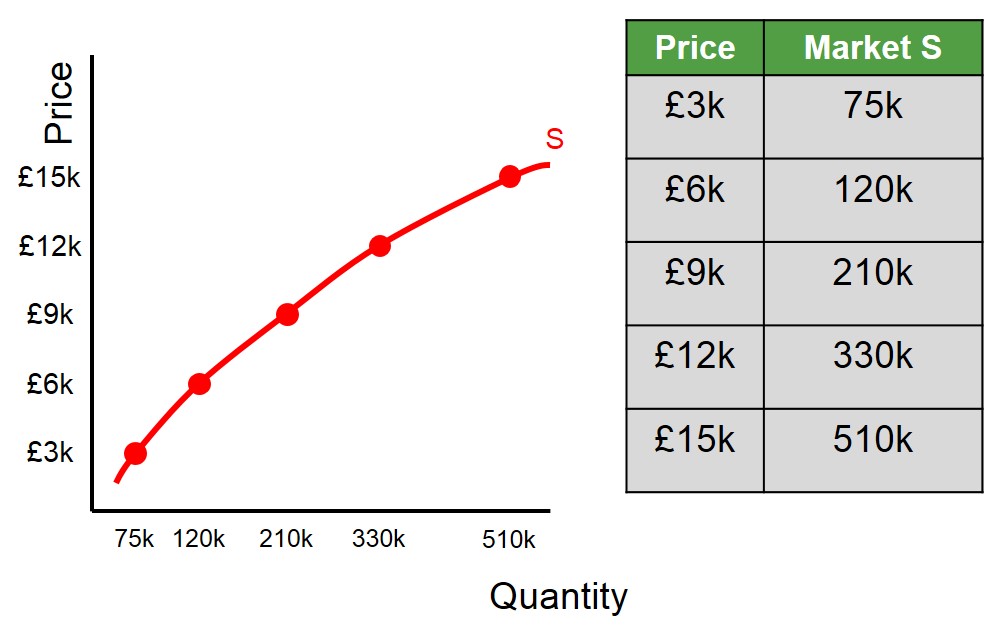
Below is the illustration of the market supply curve using the data in the table. As can be seen from the graph, the supply curve for the market has the same basic upward-sloping shape as the individual firm supply curve, to signify that the market will always be willing to supply more goods the higher the price is. This is because of the profit incentive associated with bigger margins.


Marketing economies

Scale will allow firms to enjoy pricing advantages by purchasing stock in large quantities or by negotiating exclusive deals with large wholesalers and retailers. The negotiating power of firms will increase as they grow in size.

Maturity Date

The final payment date of a bond at which point the principal is due to be paid.


Maximum Price

This is the highest price permitted by a price control.

Below is an example of a maximum price set in a market by the government to prevent a good from being sold at an excessively elevated price. In this instance this good cannot be sold below the maximum price in the market as this is strictly prohibited.


Maximum price scheme

A scheme imposed by government regulation which prevents prices rising above a certain level. Maximum prices are normally set at a level below current equilibrium price.

Below is a diagram to illustrate a successful intervention from the government to impose a maximum price in a market. Because the price is positioned below the current market price it creates an artificial excess demand. But unlike in ordinary markets, market forces do not ensure that this disequilibrium is cancelled out because the price cannot rise to a higher level above the maximum price. As a result this excess demand is left unsatisfied and increases the probability of black marketsopening up to satisfy this unmet demand.


Display # 
Forgot your password?