The EzyEducation website uses cookies to help ensure we give you the best experience.
If you continue without changing your settings, we assume that you are happy to receive all cookies on the EzyEducation website.
Please refer to our Privacy and Cookies Statement to

find out more.

Continue

Economic Terms

All   0-9   A B C D E F G H I J K L M N O P Q R S T U V W X Y Z

Producer tax burden

The amount by which the imposition of an indirect tax will reduce producer surplus. The tax burden imposed on producers will depend crucially on the elasticity of the demand curve facing the market. As the less price sensitive consumers are the more of the tax that can be passed onto them in the form of higher prices as it will increase their level of profit despite price rises due to a lack of drop-off in demand.

Below is a diagram to illustrate how the imposition of an indirect tax implaces a burden on producers. In this instance the demand curve is neither inelastic or elastic and therefore the tax burden is split evenly between the consumers and producers.

Below is a diagram to illustrate when the demand curve is inelastic and therefore the tax burden is split unevenly towards consumers ahead of producers.

Below is a diagram to illustrate when the demand curve is elastic and therefore the tax burden on producers is small.


Product differentiation

The process by which the features of products are varied and promoted to differentiate a product from other similar products.

Production

The process that converts factors of production into goods and services.


Production externality

Externalities that arise from the production of a good.

Production possibility diagram

A diagram that plots all the possible combinations of goods and services that an economy could produce.

The diagram below shows the basic shape of a country's PPF, illustrating the the distribution and allocation of resources towards producing goods to help the economy achieve the full employment level of output. Any point on the PPF is a point that is pareto optimal, productively and allocatively efficient due to the utilisation of all the factors of prodcution in the economy.


Production possibility frontier

A convex curve that graphically represents the production points for an economy where all resources are fully engaged in the production of an economy's goods and services.

The PPF is the diagram that is best used to highlight the economic problem because if an economy moves from one point on the PPF to another it involves an opportunity cost as finite and scarce resources have to be diverted from one industry to another. This increases the production of one good but decreases the production of the other. The decrease in production represents the opportunity cost and this is quantified by the gradient of the PPF at any one point.

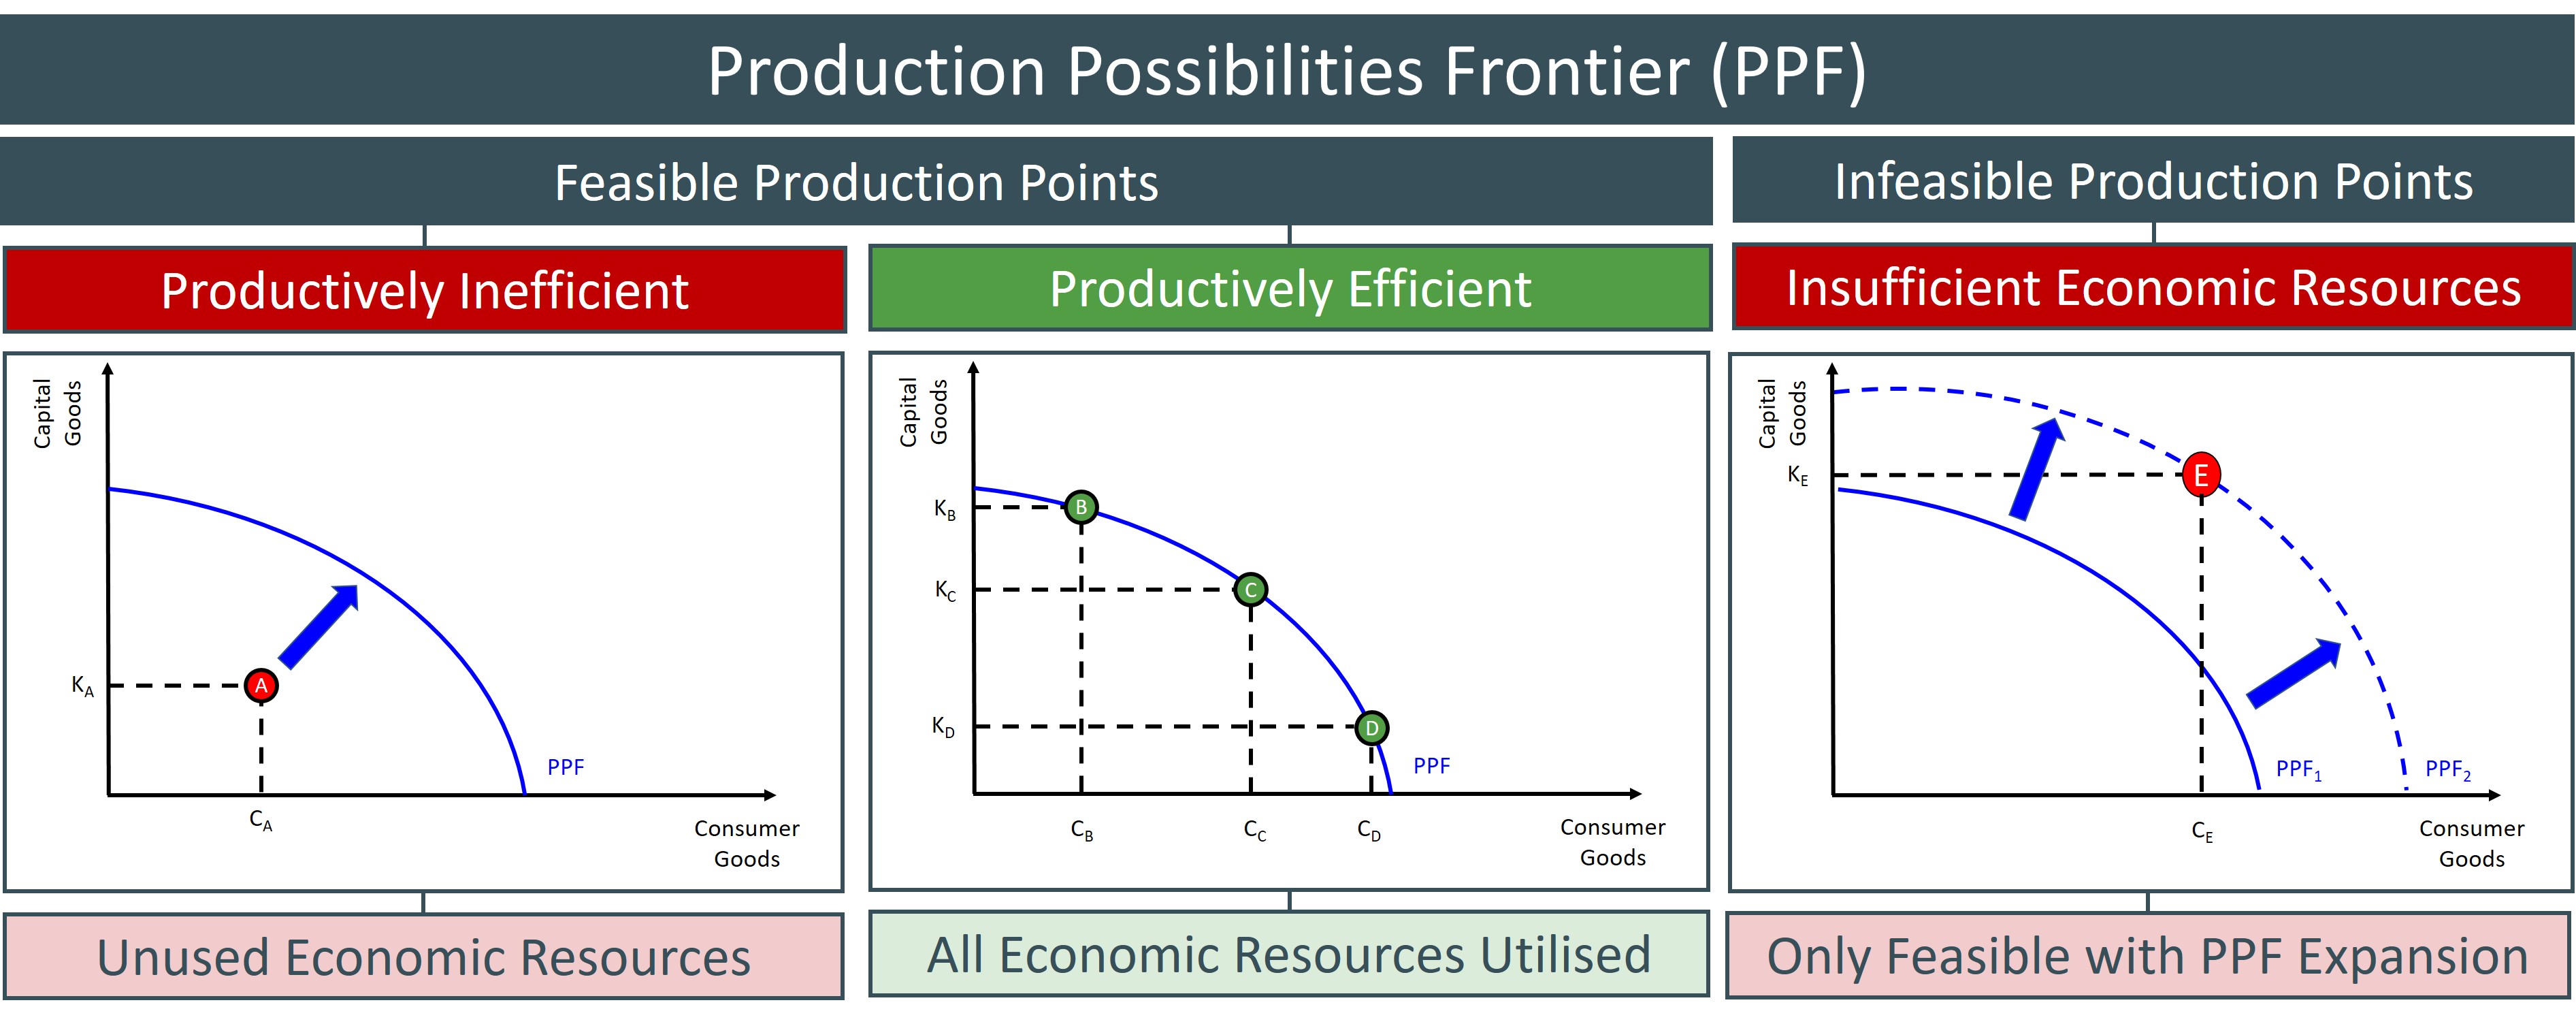
The diagram below shows the basic shape of a country's PPF, illustrating the distribution and allocation of resources towards producing goods to help the economy achieve the full employment level of output. Any point on the PPF is a point that is Pareto optimal, productively and allocatively efficient due to the utilisation of all the factors of prodcution in the economy (Point B, C, and D). However, if the economy is producing at a point inside the PPF (Point A) this represents a feasible production point, but one that is productively inefficient. This is because at this point an economy can increase the production of one good without a resultant fall in the production of another good, due to the fact that there are unemployed resources at this production point.

An economy can produce at any point on or inside the PPF. However, if the economy tries to produce at a point beyond its existing PPF (Point E), this is an infeasible production point assuming ceteris paribus. This is because even if an economy utilises all of the economic resources available any point beyond the PPF is unattainable unless an economy experiences an increase in the quality and/or quantity of factors of production available. 


Productive Efficiency

When output occurs at a point where average costs are lowest (the lowest point on the average cost curve) and all resources are fully utilised in production (actual production will position output at a point on the PPF).

Below is a diagram to show how individual firms and an economy achieve productive efficiency. For individual firms, they are charging a price at the lowest point of the average cost curve which means they are producing goods at their most productive point. For the economy to be productively efficient all firms have to be using all factors of production in the most efficient way and hence lie on the frontier of the PPF.

Productive efficiency graph


Productive inefficiency

When output occurs at a cost higher than minimum average cost (any point other than the lowest point on the average cost curve) and at a point where some resources are not utilised (and point within and not on the PPF)

Below are a set of diagrams to illustrate when individual firms and the economy are producing at a productively inefficient point and therefore costs are not being minimised.


Productive potential

The amount of goods and services that an economy is capable of producing.

Productivity

A measure of production representing the output produced by each input. It is usually measured by units of input.

Below is a graphic to assess that out of the following firms, Firm B is more productive than Firm A because it uses the same number of inputs but produces 10 times more units of output.


Display # 
Forgot your password?